
As organizations increasingly adopt DevOps practices, the need for reliable secrets detection solutions has never been greater. However, not all tools are created equal. With so many options available, how can you determine which one best answers your needs? Comparing tools can be surprisingly complex.
In this post, we’ll introduce the F1 score as the most reliable metric for evaluating their performance. By balancing recall (how many valid secrets a tool catches) and precision (how often the secret is valid), the F1 score provides a comprehensive and fair way to assess the effectiveness of secrets detection solutions.
Why Comparing Secrets Detection Solutions is Hard
When evaluating secrets detection solutions, two core metrics play a pivotal role:
- Recall: Measures how many valid secrets a tool successfully detects out of the total secrets that exist. A tool with high recall is less likely to miss exposed secrets.
- Precision: Indicates how often a detected secret is actually valid. High precision means fewer false positives.
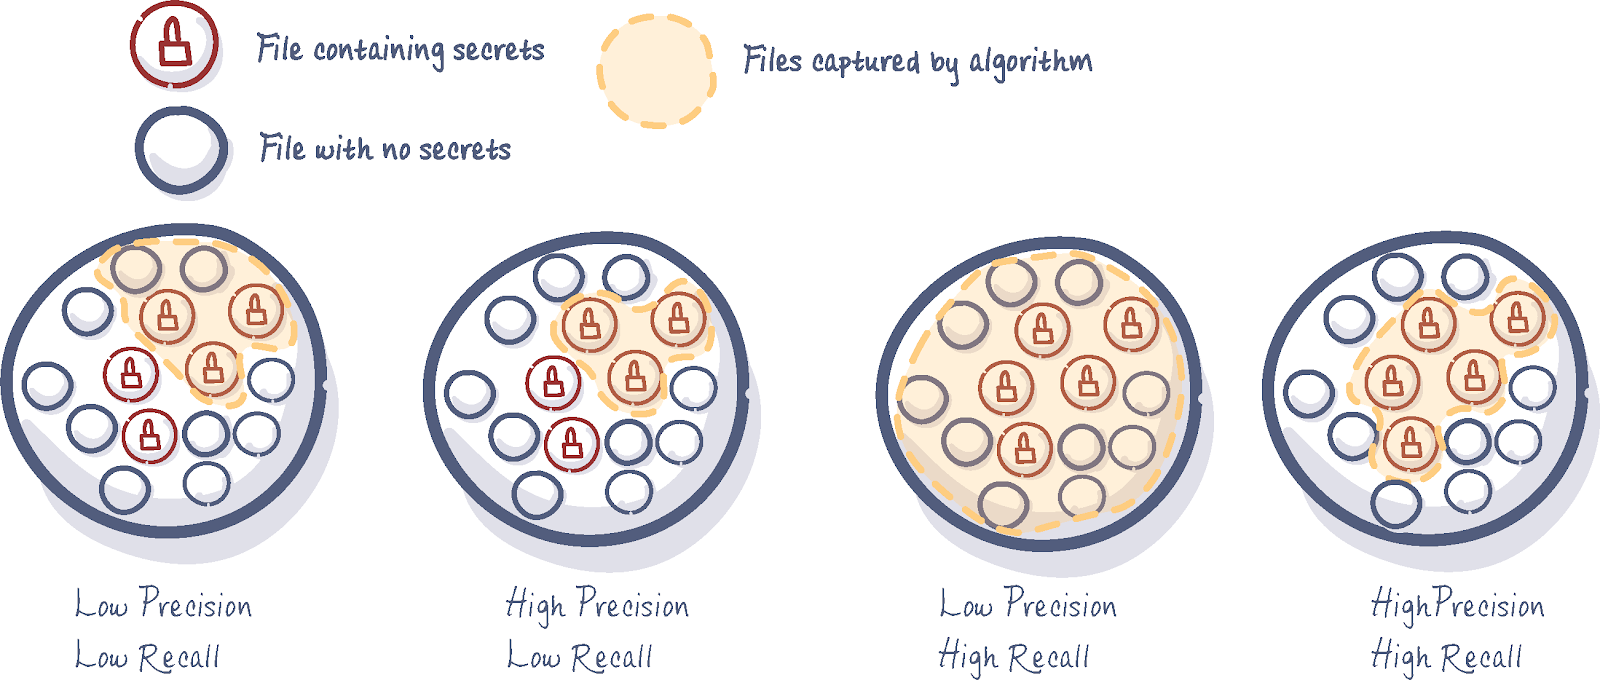
Achieving high recall without sacrificing precision is notoriously tricky. Tools with high recall but poor precision risk overwhelming users with false positives, creating inefficiencies, and eroding trust in the solution. On the other hand, tools with high precision but low recall might miss critical secrets, leaving organizations vulnerable to breaches.
Finding a solution that strikes the right balance between these two metrics is essential for effective secrets detection.
Introducing the F1 Score
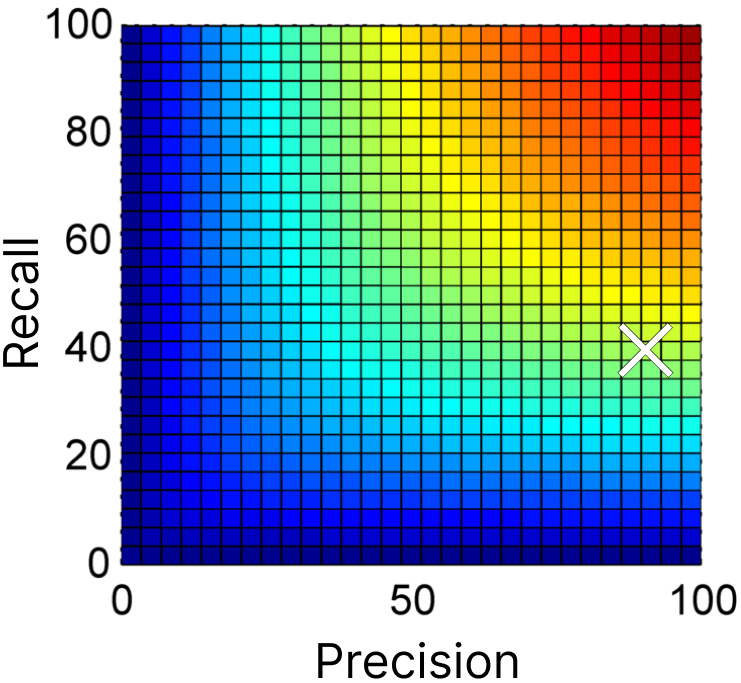
Imagine a secrets detection solutions with precision = 90% and recall = 40%. If we calculate the arithmetic mean of these metrics to evaluate the overall performance of this tool, we will get:\[ \frac{\text{Precision} + \text{Recall}}{2} = \frac{90 + 40}{2} = 65% \]At first glance, this 65% score seems reasonable. However, it overemphasizes the higher metric (precision) and ignores the gap in recall, which reflects missed critical secrets.
Other types of means exist. The harmonic mean, rather than the simple arithmetic mean, is particularly useful for datasets with imbalanced metrics, like when precision and recall vary significantly. Here, it would be\[ \text{Harmonic Mean} = \frac{2 \times (\text{Precision} \times \text{Recall})}{\text{Precision} + \text{Recall}} = \frac{2 \times (90 \times 40)}{90 + 40} = 55.38\% \]This 55% score feels very different; you probably won’t trust this solution.
This score highlights the real-world challenge: high performance in one area cannot compensate for poor performance in another.
That’s how the F1 score was built. The F1 score is the harmonic mean of recall and precision, widely used when working on predicting algorithm.\[ \text{F1} = \frac{2 \times (\text{Precision} \times \text{Recall})}{\text{Precision} + \text{Recall}}\]By penalizing extreme differences between recall and precision, the F1 score allows organizations to compare solutions fairly without overemphasizing one parameter at the expense of the other.
By balancing the risks of missed secrets and team overload, the F1 score provides a practical way to rank tools based on their overall performance.
When You Might Prioritize Recall or Precision Over F1
There are cases where one metric matters more than their combination:
Focusing on Recall
In high-stakes scenarios like post-breach investigations or audits, missing even one secret can be catastrophic. Maximizing recall ensures every potential secret is flagged, even if it results in more false positives that require investigation.
Focusing on Precision
When reducing false positives is critical—such as in a SOC handling numerous alerts or workflows that automatically generate Jira tickets upon incident detection—high precision helps prevent alert fatigue and streamlines operations. Slightly lower recall is acceptable if it means focusing on actionable incidents without overwhelming teams.
Ultimately, your priorities—avoiding noise or catching every secret—should guide whether precision or recall takes precedence. For most mature enterprises, both high recall and precision are required in the long run, meaning a high F1 score.
How to Compare F1 Scores and Performance of Solutions
Evaluating the performance of secret detection solutions is inherently challenging because there is no perfect, hand-labeled dataset of secrets available for benchmarking. The main reasons include:
- Data Sensitivity – No organization will publicly share a dataset containing real secrets, as doing so would be a major security risk.
- Dataset Limitations – Any publicly available dataset will either be artificially generated or fail to replicate the real-world conditions of an organization.
As a result, benchmarks must rely on actual datasets from real-world scenarios. This introduces a fundamental limitation: we cannot determine the absolute recall of a tool because the total number of real secrets in the dataset is unknown. Labeling datasets at a scale large enough to perform unbiased comparison would be prohibitively time-consuming and resource-intensive.
While this approach does not provide an absolute measure of performance, it allows for meaningful comparisons between solutions by focusing on their effectiveness in detecting real secrets under the same conditions. When a solution detects a secret, we can validate it by attempting to use the secrets (ethically and in controlled environments) to confirm whether they work or, if feasible,by checking with the platform or service provider to confirm validity.
How to Compute the F1 Score: An Example
Let’s take an example of four different secret detection solutions evaluated on the same dataset of real-world data. From this evaluation, you can gather two key pieces of information:
- The total number of secrets detected by each solution (their findings).
- The number of valid secrets detected (true positives), after testing and validating each finding.
Here are the results from this experiment.
| Solution | Total of secrets detected | Number of valid secrets detected (True Positives) |
|---|---|---|
| Solution A | 3,000 | 2,700 |
| Solution B | 9,000 | 6,500 |
| Solution C | 7,000 | 6,000 |
| Solution D | 5,000 | 4,600 |
Step 1: Calculating Precision
Precision measures how many of the detected secrets are valid. It is calculated using the formula \[ \text{Precision} = \frac{\text{True Positives}}{\text{True Positives} + \text{False Positives}}\]In other words, it’s the ratio of valid secrets to the total secrets detected by the tool.
| Solution | Number of valid secrets detected (True Positives) | Number of invalid secrets detected (False Positives) | Precision |
|---|---|---|---|
| Solution A | 2,700 | 300 | 90.0% |
| Solution B | 6,500 | 2,500 | 72.2% |
| Solution C | 6,000 | 1,000 | 85.7% |
| Solution D | 4,600 | 400 | 92.0% |
If we look at precision alone, Solution D appears to be the best, with 92% of its findings being valid. However, it also misses many valid secrets that were detected by Solutions B and C. That’s the reason why you need to consider their recall as well.
Step 2: Calculating Recall
Recall measures how many of the actual secrets in the dataset are detected. It is defined by\[ \text{Recall} = \frac{\text{True Positives}}{\text{True Positives} + \text{False Negatives}}\]It’s the Number of valid secrets detected divided by the Total number of actual secrets in the dataset.
Here, we face a challenge: determining the total number of actual secrets in datasets large enough for meaningful comparisons, is prohibitively expensive. This number remains unknown in real-world scenarios because no hand-labeled dataset fully replicates actual data. So, how do we calculate recall?
Let’s look at the distribution of secrets.
When secret detection solutions analyze a dataset, they do not detect identical sets of secrets. Each solution has different detection capabilities, leading to variations in their findings. Some secrets may be detected by multiple solutions, while others might be unique to a single tool. This overlap, and the differences between findings, are key to understanding the dataset's composition.
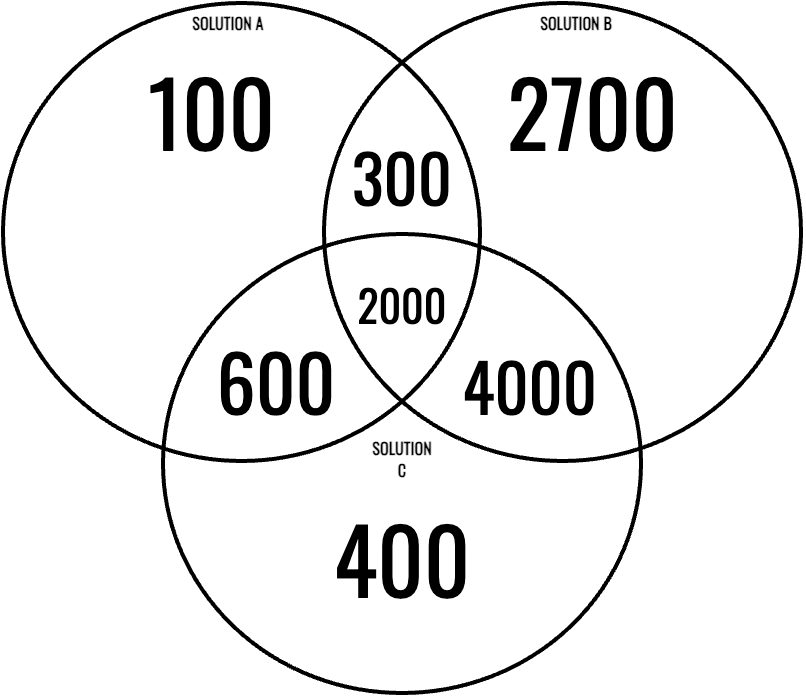
Since we do not have a ground-truth dataset with pre-labeled secrets, the best assumption we can make is that the total number of actual secrets in the dataset corresponds to the union of all valid secrets detected across all solutions.
In this example, there are many findings\[\text{Total Findings} = 100 + 2700 + 400 + 600 + 300 + 4000 + 2000 = 10,100\]To determine the actual number of secrets in the dataset, all detected findings need to be validated. While this approach is an approximation, it is the most reliable method available. Even when combining the findings from all solutions, some secrets may still be missed. However, this approximation provides a solid baseline for fairly comparing the performance of each solution relative to the others.
For this example, we assume the dataset contains 8,000 actual secrets—a reasonable midpoint based on validation results.
Interestingly, Solution B reported 9,000 findings, more than our estimated total of actual secrets. This suggests that Solution B’s detectors over-identified secrets, likely misclassifying some non-sensitive data as secrets, generating even more false positives.
Here’s the recall calculation for each solution.
| Solution | Number of valid secrets detected (True Positives) | Number of valid secrets NOT detected (False Negatives) | Recall |
|---|---|---|---|
| Solution A | 2,700 | 5,300 | 33.8% |
| Solution B | 6,500 | 1,500 | 83.1% |
| Solution C | 6,000 | 2,000 | 75.0% |
| Solution D | 4,600 | 3,400 | 57.5% |
If we look at recall alone, Solution B is the top performer, detecting 83.1% of the actual secrets. However, it comes with a drawback: 2,500 false positives, which could overwhelm security teams with invalid alerts.
Step 3: Calculating the F1 Score
Now, let’s compute the respective F1 score of all solutions.
| Solution | Recall | Precision | F1 Score |
|---|---|---|---|
| Solution A | 33.8% | 90.0% | 49.1% |
| Solution B | 83.1% | 72.2% | 76.5% |
| Solution C | 75.0% | 85.7% | 80.0% |
| Solution D | 57.5% | 92.0% | 70.8% |
Solution C has the highest F1 score in this example, making it the best overall solution. Although it doesn’t have the highest recall or precision, it strikes the best balance between the two, detecting many valid secrets while keeping false positives relatively low.
This demonstrates the importance of looking beyond a single metric (precision or recall) and considering the F1 score when comparing secret detection solutions.
Adding Some Nuance: Why Some Secrets Matter More
Not all secrets carry the same level of risk. Cloud provider credentials and identity service secrets are among the most critical for enterprises and other organizations, as they can grant attackers broad access to highly sensitive systems. In contrast, an API key for a music streaming service may pose minimal risk to an organization.
To assess a tool’s effectiveness, enterprises may prioritize evaluating its performance on the types of secrets that matter most to them. This means focusing on categories of high-risk secrets—such as cloud credentials, database passwords, or private keys—rather than treating all detections equally.
How to Survive Low Precision with Efficient Prioritization
A tool with poor precision can still be effective if it has strong recall and the right prioritization strategies. Security teams, especially in large enterprises, focus on high-impact incidents first, ensuring critical secrets are addressed before lower-priority findings.
Efficient Triage: Focusing on Critical Leaks
Not all exposed secrets pose the same risk. A cloud provider API key is far more dangerous than a test credential. Enterprises prioritize based on impact, so a tool with high recall ensures critical leaks aren’t missed, even if some false positives need filtering.
Prioritization Helps But Isn’t a Silver Bullet
Unlike provider-specific secrets, generic secrets lack explicit identifiers, making them harder to classify automatically. Prioritization algorithms will not prioritize them correctly.
Moreover, even with prioritization, poor precision leads to alert fatigue. The best defense is high recall with strong precision—catching real secrets while minimizing noise.
Looking for the Best Solution
Choosing the best secrets detection tool isn’t just about finding the one with the highest recall or the fewest false positives—it’s about balancing precision and recall to ensure real-world effectiveness. The F1 score is the most reliable way to compare solutions fairly, as it accounts for both factors. The ideal solution finds the right trade-off, maximizing true positives while minimizing noise. However, it's important to remember that even a single missed secret can lead to a breach, so solutions with poor recall should be approached with caution.
It's also important to consider the context. Organizations should tailor their evaluation based on the types of secrets that pose the highest risk to them. A solution that performs well on highly critical secrets, such as cloud access keys or authentication tokens, will provide more security than one that simply maximizes detections without differentiation.
Finally, beware of tools that claim near 100% recall—such a claim likely indicates a lack of real-world constraints. This would mean the solution is not designed to be as efficient with actual data. The best secrets detection solution isn’t the one that flags the most findings; it’s the one that helps your security team take the right actions.