|
Michaël RomagnéMichaël is a Machine Learning Engineer at GitGuardian, focused on integrating advanced NLP models into the platform and implementing MLOps best practices across the company. |
Today's Machine Learning Engineers are no longer confined to experimental notebooks – they are architects of production-ready AI systems that drive business impact.
As hands-on developers, they need a tech stack that enables rapid experimentation and smooth deployment to production while maintaining their independence and workflow efficiency.
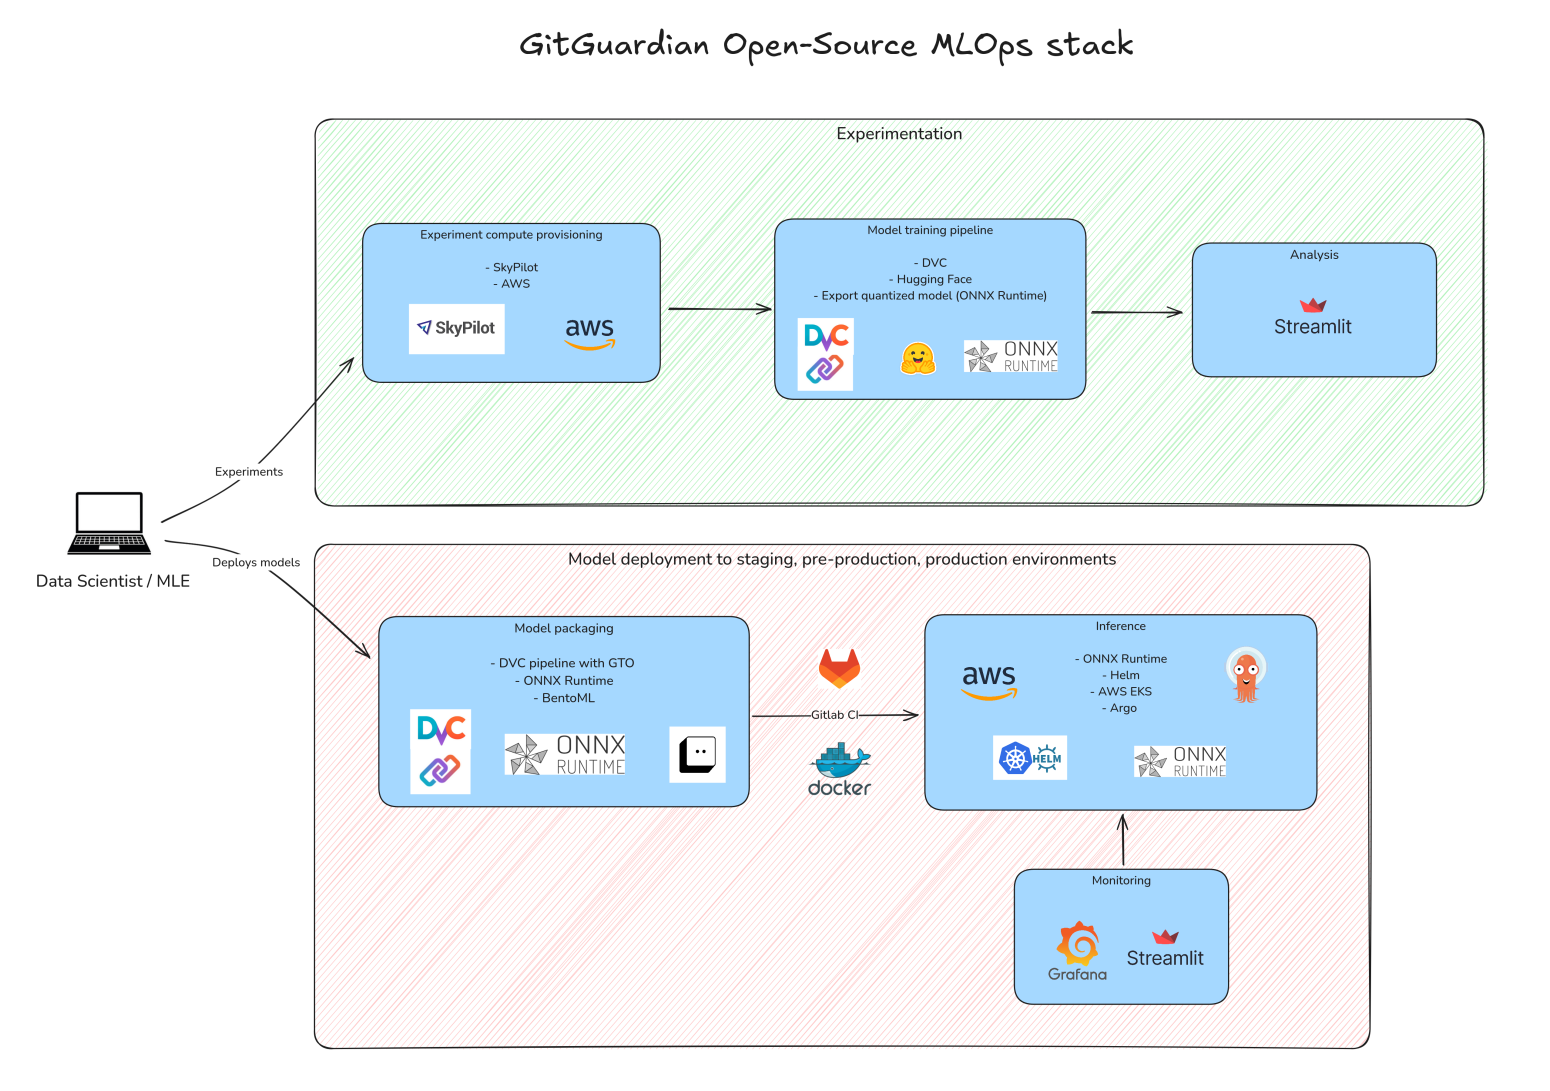
At GitGuardian, we leverage state-of-the-art NLP techniques to solve critical cybersecurity challenges. Our primary focus has been on reducing false positives in our Secrets Detection Engine and using contextual analysis to identify services associated with leaked secrets. To support these tasks from experimentation to launch, we’ve put together a complete MLOps stack powered by open-source technologies.
In this article, we’ll review the key pieces of our tech stack and demonstrate how they help us run repeatable experiments, work together smoothly, and manage our resources effectively. Let's go!
Building a Robust ML Experimentation Pipeline
The GitGuardian ML team's core mission is to fine-tune Transformer models to achieve the highest precision while maintaining fast inference speeds. This type of model requires substantial computing resources for effective training.
From the start, the team had identified three major pain points that were significantly impacting our development velocity and team collaboration:
- Our datasets, models, and experiments were difficult to track, share, and reproduce because we didn't have version control in place.
- We lacked a flexible way to visualize metrics and explore our data, making it challenging to gain actionable insights during the experimentation process.
- ML Engineers spent excessive time manually configuring and setting up EC2 instances in AWS for prototype training, which led to workflow inefficiencies and reduced productivity.
To address these challenges, we needed a robust MLOps infrastructure that would streamline our workflow. After carefully evaluating various tools and approaches, we decided to build our stack around three core open-source technologies that would address these specific challenges.
Version Control for ML Assets with DVC

The first solution we implemented is DVC (Data Version Control), which has become essential to our experimentation pipelines. DVC lets us version datasets, model artifacts, and parameters right alongside our code, making our workflows more efficient and team collaboration smoother. As Iterative puts it simply: “DVC is Git for Data.”
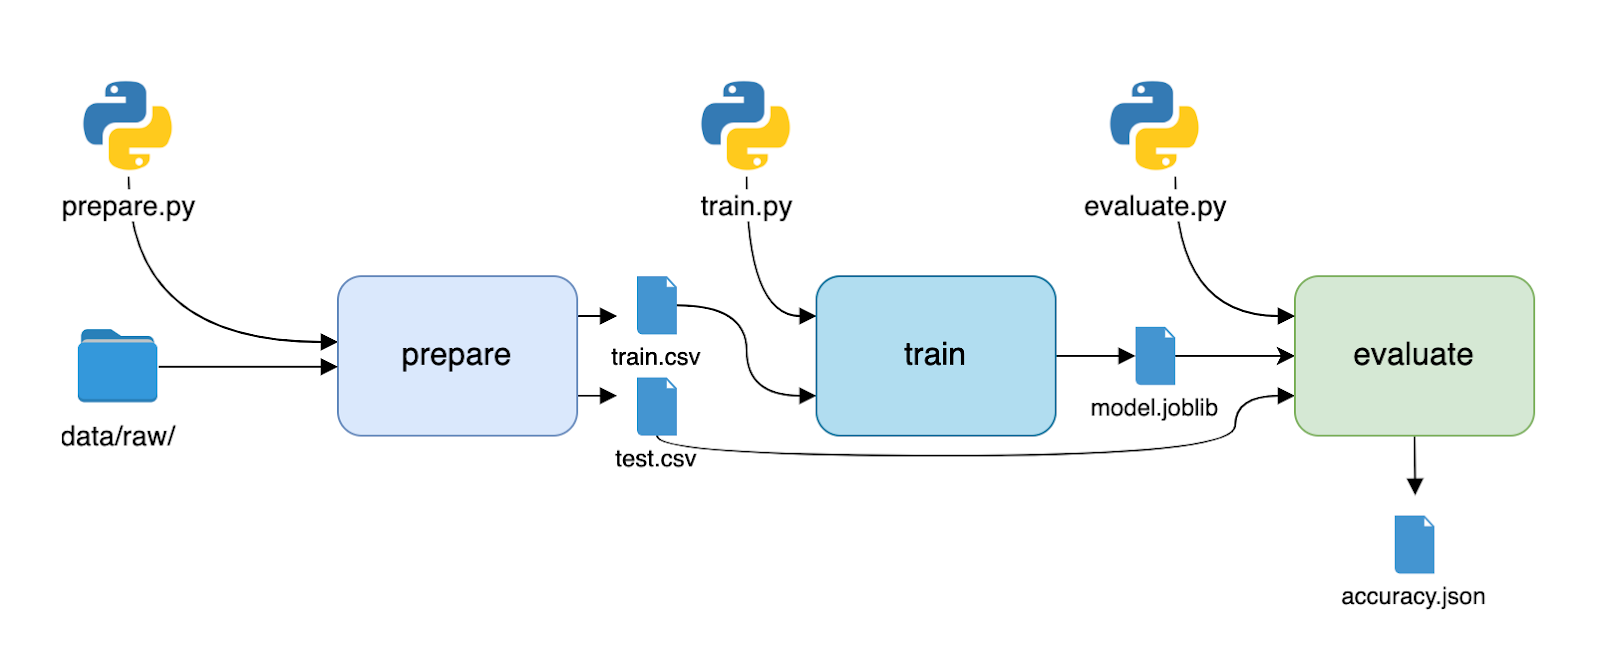
A DVC pipeline lives in a dvc.yaml file:
stages:
  prepare:
    cmd: python prepare.py
    deps:
      - prepare.py
      - data/raw/
    outs:
      - train.csv
      - test.csv
  train:
    cmd: python train.py
    deps:
      - train.py
      - train.csv
    outs:
      - model.joblib
  evaluate:
    cmd: python evaluate.py
    deps:
      - evaluate.py
      - model.joblib
      - test.csv
    metrics:
      - accuracy.json
Here’s what this typical training pipeline might look like:
DVC has a lot to offer to streamline ML workflows:
- Reproducibility: Ever had that moment when you can't recreate the exact conditions that led to your best model? DVC solves this headache by tracking everything - your data, code, parameters, and dependencies - across all pipeline stages. It's like having a time machine for your experiments - you can jump back to any previous version of your model or results with just a few commands.
- Pipeline modularity: With DVC, each pipeline stage is a distinct piece that you can easily swap out or modify when you need to tweak something, without rebuilding the whole thing.
- Data Versioning: DVC handles the heavy lifting by storing just lightweight .dvc pointer files in Git to track only small files and references while efficiently managing your actual data files elsewhere. It's like having a smart storage system that knows exactly where everything is without bloating your repository.
- Caching: DVC's caching is smart enough to know what's already been computed and only runs what's necessary - saving you precious time and computing resources.
- Collaboration: DVC makes collaboration actually work in ML projects. Your team can share results and parameters through Git while DVC handles the big files behind the scenes.
These features make DVC an indispensable tool for MLOps teams to iterate fast while maintaining reproducibility with large datasets and complex pipelines.
Now that artifacts are versioned for each experiment, how can we efficiently manage them?
Model Registry with GTO

In addition to DVC, Iterative maintains GTO (Git Tag Ops), a tool that lets you tag your best models and artifacts. GTO creates a simple mapping between (artifact_name, version) and (file_path, commit_hash), making model versions easily accessible to MLEs. Instead of dealing with complex file paths or commit hashes, you can reference models using a simple name and tag, like my_awesome_model@v0.0.1, or assign stages like my_awesome_model#prod.
GTO is a great basis for creating an artifact registry within your Git repository, with the Model Registry being a particularly valuable implementation. As Iterative explains:
“Such a registry serves as a centralized place to store and operationalize your artifacts along with their metadata, manage artifact’s life-cycle, versions & releases, and easily automate tests and deployments using GitOps.”
We’ll explore how to leverage these versions in our release pipeline later in this article.
The combination of DVC and GTO enables us to reference specific commits in our Git history and easily retrieve key artifacts like models, datasets, and parameters. This capability is crucial for team collaboration and efficiency.
Awesome Web Apps with Streamlit

While DVC excels at versioning, it wasn't designed to provide interactive exploration of pipeline outputs like metrics or model behavior. Iterative has in fact developed DVC Studio for this, but this is not an open-source library.
We thus searched for a lightweight and flexible tool to build web applications for comparing experiments and sharing results with teammates and the broader company. Streamlit has imposed itself as the standard for building simple web apps with custom visualizations, thanks to its intuitive library and strong community that develops various plugins to enhance the tool.
Here is an example of a simple UI that helps both our ML teams debug their models and enables other teams to experiment with the ML team's work:
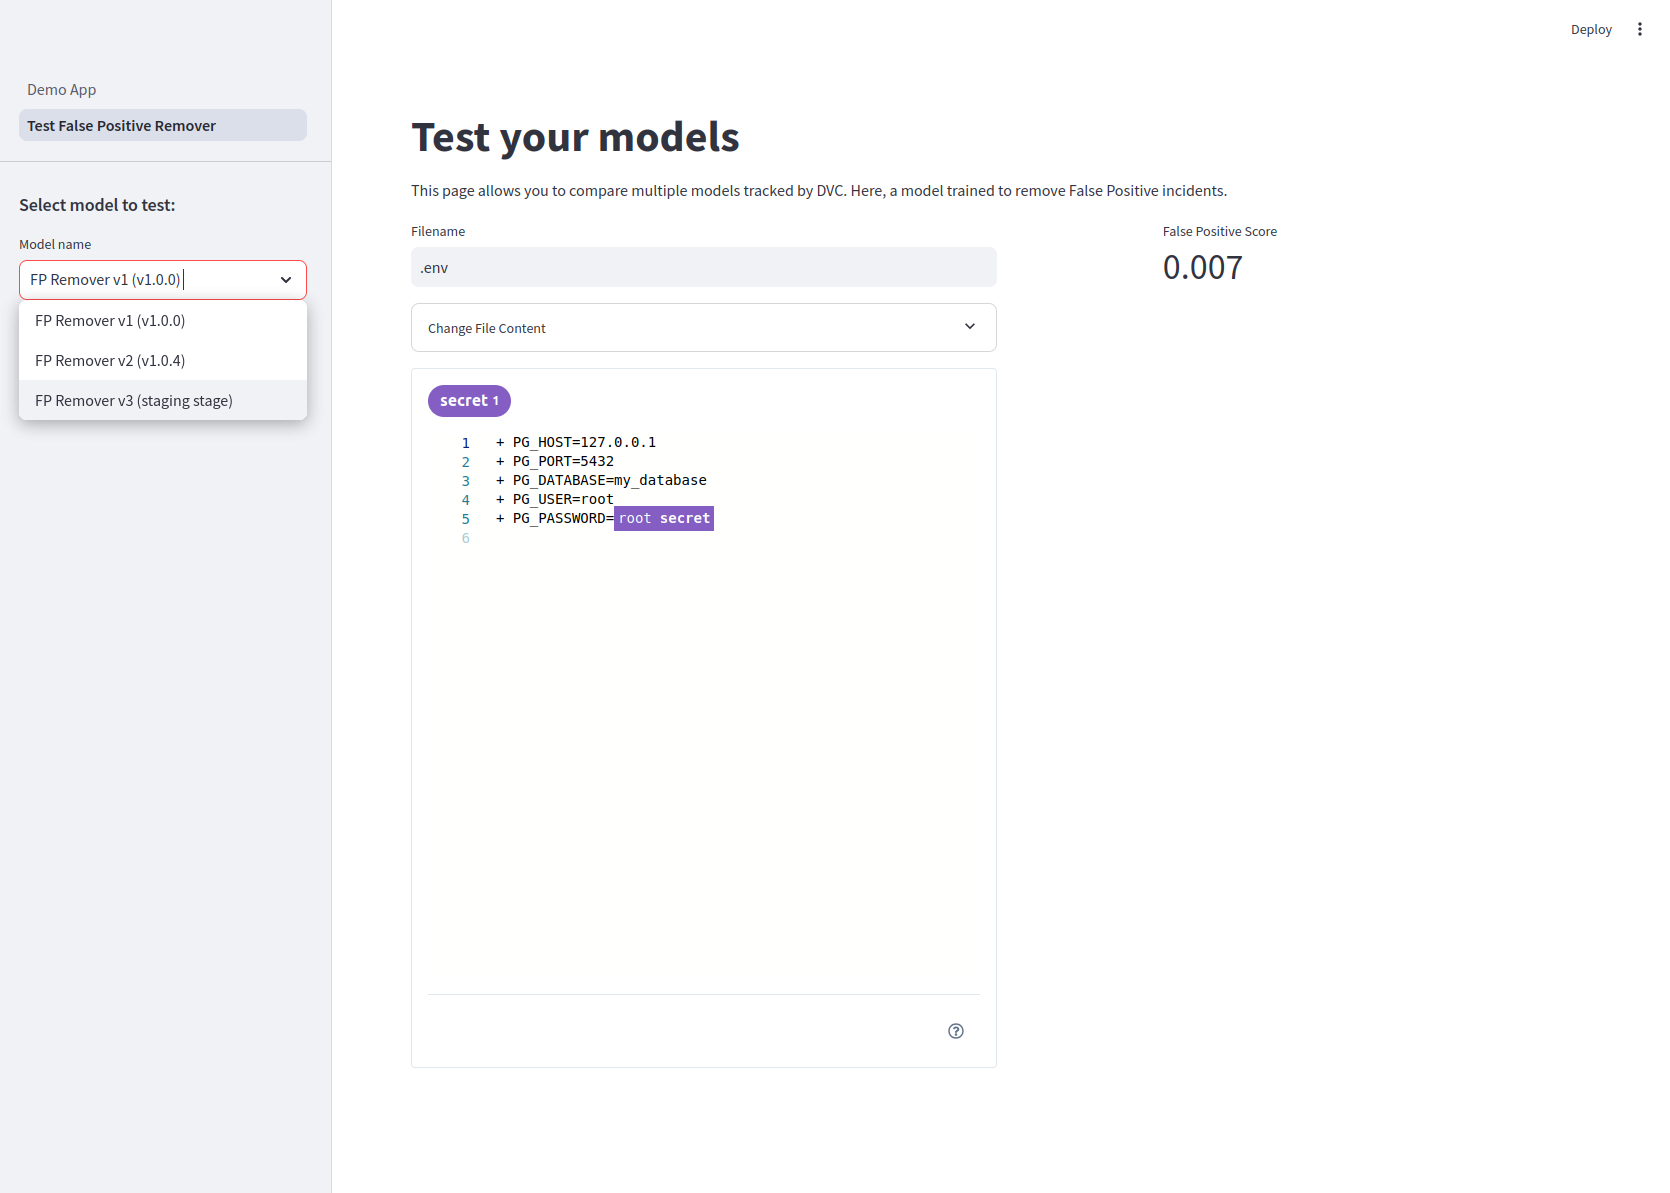
Thanks to DVC, retrieving previous versions of our model and getting prediction scores (in this case, the False Positive Score) on custom inputs ( the .env file content) became straightforward. Streamlit is the ideal tool to tinker with models and display such predictions.
Easy Cloud Instances Config with SkyPilot

With versioning and data visualization under control, the transition to managing cloud resources was the next logical step. To automate the creation and configuration of AWS EC2 instances, we chose SkyPilot. The install is really easy, and once your Cloud Provider credentials are set, all you need is to create a skypilot.yaml manifest like the one below:
resources:
  cloud: aws
  # A GPU instance with 1 Tesla V100
  instance_type: p3.2xlarge
  region: # region
  # use_spot: true
  image_id: # we use Deep Learning AMI GPU PyTorch 2.0.0 (Ubuntu 20.04) in eu-west-1

workdir: ./

envs:
  ENV_VAR: value

file_mounts:
  ~/.netrc: ~/.netrc

# Install PDM and python dependencies
setup: |
  echo "Running setup."
  export PYTHONPATH="/home/ubuntu/sky_workdir:$PYTHONPATH"
  export PATH="/home/ubuntu/.local/bin:$PATH"
  echo 'export PYTHONPATH="/home/ubuntu/sky_workdir:$PYTHONPATH"' >> ~/.zshrc
  echo 'export PATH="/home/ubuntu/.local/bin:$PATH"' >> ~/.zshrc
  pip install --user pdm && pdm install -L pdm.gpu.lock

# Run DVC pipeline and push the results to remote storage.
run: |
  source ~/.zshrc
  pdm run dvc exp run -s --pull scripts/training/dvc.yaml -n $EXPTAG
  pdm run dvc exp push origin $EXPTAG
You then have full control over your cloud instances and cluster at your fingertips:
- Create instances and run scripts:
sky launch -c mycluster skypilot.yaml - See status of instances:
sky status - Kill a cluster:
sky down mycluster - Automatically schedule an autostop of the cluster 10 minutes after the end of the task, and launch the cluster in detached mode:
sky launch -d -c mycluster2 cluster.yaml -i 10 --down - SSH into a cluster:
ssh mycluster
This stack makes experiments both scalable and reproducible. Metrics are presented through neat visualizations, while intuitive tagging makes artifacts accessible to everyone. All essential building blocks are in place to develop high-quality Machine Learning models. The final step is to package and deploy these models.
Package and Serve NLP models
Build an Inference Service in a blink with BentoML

For our first integrations in GitGuardian’s products, we developed services that could serve our top-performing models under heavy load while maintaining state-of-the-art performance. The packaging process needed to be straightforward so that any team member could easily build and deploy their own service.
BentoML proved to be an excellent solution for several key reasons:
- It’s built upon Starlette, an ASGI framework designed for building asynchronous Python web services
- It offers multiple integrations for serving modern NLP models, including ONNX Runtime and vLLM
- Its Services / Runners function as task queues, allowing you to manage traffic through max concurrency settings, timeouts, and micro batching
- It’s flexible enough to build complex inference workflows while exposing models through REST or gRPC endpoints
In BentoML, the definition of a Service can be as simple as that:
import bentoml
from transformers import pipeline

@bentoml.service(
    resources={"cpu": "2"},
    traffic={"timeout": 10},
)
class Summarization:
    def __init__(self) -> None:
        self.pipeline = pipeline('summarization')

    @bentoml.api
    def summarize(self, text: str) -> str:
        result = self.pipeline(text)
        return result[0]['summary_text']
BentoML allows the packaging of models with all necessary dependencies into 'bentos', that are essentially folders that can later be used to build a Docker image. By making use of DVC and GTO to track these bentos, the deployment of ML inference services can be automated through CI/CD. Here is a DVC pipeline example to build a bento:
# Artifacts section for GTO
artifacts:
  my_awesome_model:
    path: data/models/my_awesome_model
    desc: My awesome model.
    type: model
    labels:
      - demo

stages:
  # Push prod model artifact to the BentoML model store
  store_models:
    cmd:
 BENTOML_ENV=development BENTOML_DO_NOT_TRACK=true BENTOML_HOME=$(pwd)/data/bentoml \
      python -m demo.save_to_bento \
      --model-artifact-name my_awesome_model \
      --model-artifact-stage prod
    deps:
      - demo/save_to_bento.py
      # Add other important files to track
    outs:
      - data/bentoml/models/

  # Build the bento folder
  build_bento:
    cmd:
      BENTOML_DO_NOT_TRACK=true BENTOML_HOME=$(pwd)/data/bentoml \
    bentoml build --bentofile demo_model/bentofile.yaml --version demo-version
    deps:
      - demo/bentofile.yaml # Config file for the service
      # Add other important files to track
    outs:
      - data/bentoml/bentos/my_awesome_model/demo-version
BentoML helps teams create complete inference services with just a few lines of Python code, while managing all service settings through a single YAML file. With simple commands, you can package your service into a Docker image that's ready for high-performance deployment on any cloud platform. The main concepts behind the tool are detailed in this blog post that we highly recommend as an introduction.
Optimizing Production for Real-Time and Batch Secrets Classification
Our production deployment architecture is designed around three key requirements:
- We need real-time ML classification as soon as a secret leak is detected
- We have a large historical database of secret leaks that requires periodic analysis. For example, when deploying a new model, we need to recompute classifications for all historical incidents.
- Input data contains sensitive information and must remain within our production Kubernetes cluster's security boundary
We use ONNX Runtime to power our Transformer model’s inference engine. By leveraging optimizations like graph optimization and quantization, we achieved excellent real-time performance with low latency, even on modest CPU instances.
For our compute-heavy back-population jobs, where we periodically reprocess our extensive history of secret leaks, we needed more flexible scaling options. To manage these demand spikes efficiently, we implemented Kubernetes’ Horizontal Pod Autoscaler (HPA). This automatically adjusts our deployment size based on incoming request volume, ensuring we maintain optimal performance during peak periods without wasting resources during quiet times.
As the final step, we implemented comprehensive monitoring and logging. Tools like Prometheus and Grafana provide real-time insights into model performance and system health, allowing us to catch potential issues early. Monitoring metrics such as latency, request rates, and error rates gives us a clear view of our service's responsiveness and reliability. For more sophisticated visualizations, particularly for business monitoring, we created dedicated Streamlit web applications.
Conclusion
That’s a wrap for the overview of the GitGuardian MLOps stack! As you've seen, we designed it to be modular and to achieve an ideal tradeoff between usability and performance.
While we did not tackle some aspects of our setup, such as our complete service testing suite and job orchestration, we hope this article provides a practical guide and inspiration for ML engineers building or refactoring their own MLOps stack to meet the demands of modern Machine Learning.
